

In today's fast-paced business landscape, staying ahead of the competition requires efficient and effective solutions. According to Microsoft’s Work Trend Index, nearly 70% of employee report that they don’t have sufficient time in the day to focus on “work”, with more time being spent Communicating than Creating.
Microsoft 365 Copilot is designed, with Microsoft’s cloud trust platform at its core, to allow for employees to both be more productive, reduce the time spent searching for information, performing mundane tasks, and other low-value activities.
Azure / Power BI
This is a continuation of our series on “weird data wrangling” scenarios. In this blog post, I will tackle some interesting data on Major League Baseball play by play data.
I sourced the data from Retrosheet (www.retrosheet.org), a website that maintains a huge trove of data related to Major League Baseball games. The data used was obtained free of charge from and is copyrighted by Retrosheet. Interested parties may contact Retrosheet at "www.retrosheet.org." A basic skill level and understanding of Microsoft Azure and Power BI are assumed by this blog post.
I have been spending a good amount of my time lately brushing up on Azure Data storage options for Power BI. Microsoft offers several options when it comes to storing and analyzing data in Azure, but this blog post will focus on connecting to Azure Data Lake Gen2 with Power BI Dataflows. Storing the data in Azure Data Lake Gen2 or the less expensive (but still “connectable” via Power BI) Azure Blob Storage helps me keep data organized by subject (resource groups) and I do not have to fill up my hard drive with some of the larger datasets.
Data Retrieval
On the retrosheet.org website, navigate to the data downloads menu and select “Play by Play files.” Retrosheet calls their play by play files “event files” and there are options to download individual seasons, postseason games, all-star games, or group any of the above by decade. In the “Regular season event files by decade section, click the “2010-2019” link to download zip files of the last 10 years of play by play data. We will also need some reference (dimension) files, they are listed below, and we will download each of them:
- Player, manager, coach, and umpires: https://www.retrosheet.org/retroID.htm
- Teams: https://www.retrosheet.org/TEAMABR.TXT
- Ballparks: https://www.retrosheet.org/parkcode.txt
Data Preparation
The play by play data has a unique format. Expand the downloaded zip files to examine their contents and you will see the following files:
- Event files (American League) - year, team abbreviation, and a .EVN file extension
- EVN = 2010 Chicago Cubs (National League) events
- Event files (National League) - year, team abbreviation, and a .EVA file extension
- EVA: 2019 New York Yankees (American League) events
- Roster files – team abbreviation, year, and a .ROS file extension
- ROS: 2012 roster of players for the Pittsburgh Pirates
These files are comma-delimited text files, in a “jagged” format. Jagged refers to the fact there is not the same number of values on each line. If you open the file in a text editor, the right side will not be justified, but appear “jagged,” hence the name. This is since information about the game and record-keeping is inside each file. Three is a maximum of 7 columns in the text file, and the first column indicates the type of record. Each tag type is briefly described below:
- com – comments about the game
- data - the number of earned runs allowed by the pitcher (this is all that is in the data records at present)
- id - this starts the records for each game, the 12 characters indicate the home team, year, month, day, and game type (0 = single game, 1 = 1st game of doubleheader and 2 = 2nd game of doubleheader)
- info - there are up to 34 records in the information tag, containing items like attendance, temperature, game time, umpire identity, etc.
- play - this is the play record tag and is what we are interested in. This contains the playerid of the batter, count (balls, strikes) of the play, and pitch sequence outcomes (e.g., pickoff throws, ball, strike, hit by pitch, foul tip, etc.)
- start - identifies the starting lineup for each game
- sub - identifies any substitutions for each game (player replacement)
- version - this is obsolete and can be ignored
I highly encourage the reader to look over the detailed information about the files on the Retrosheet website: https://www.retrosheet.org/eventfile.htm. The dataset is rich for a curious data-minded baseball fan like myself. I had a hard time narrowing down what I wanted to analyze, so I wanted to present in this blog how the information could be architected to use later when new questions arise.
One minor thing we need is to change the file extensions from .EVA and .EVN to .txt. I accomplished this with a DOS ren (rename) command in the folder where I extracted the play by play files:
>> ren *.EV* *.txt
Prepare Azure Storage Account and Upload Data
We now need to prepare our landing spot in Azure for the play by play files. To do this, we will create a storage account and a container where we will upload our downloaded play by play and reference (teams, ballparks, players) files. To keep things nice and tidy, I created a resource group named “MLBBlogData.”
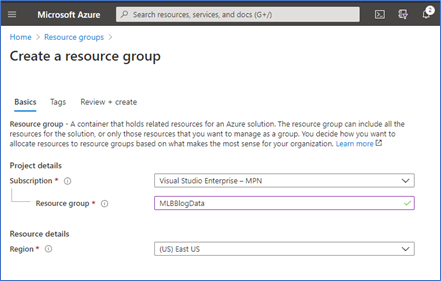
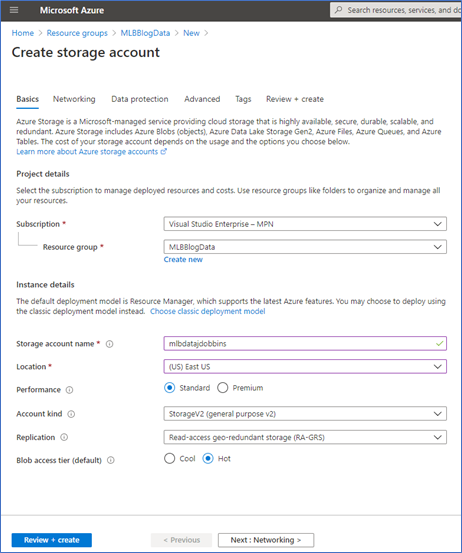
Now that we have our resource group, let’s create a storage account (Gen2) resource. Make sure the resource is in the same region (East US for my example).
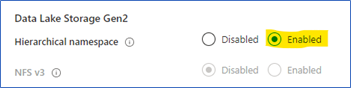
Before clicking “Review and Create” go to the Advanced tab and enable the Hierarchical Namespace. This is what converts Azure Blob Storage into an Azure Data Lake and allows for Hadoop compatible access among other features described here.
Now, create a container to hold the files, in my case I named it “mlbdata.” Upload all of the play by play and reference files into the container, using either the web interface or Azure Storage Explorer.
Prepare Power BI
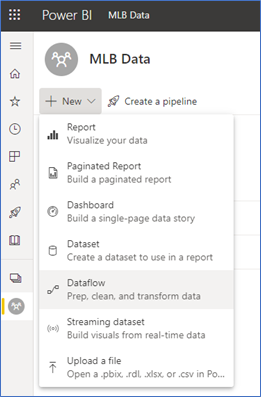
In Power BI, I created a separate workspace for this work, named “MLB Data.” The workspace is a V2 workspace and is a regular (non-Power BI Premium workspace). I should note here that the workspace you use could be “My Workspace.” Inside the workspace, click New and select “Dataflow.”
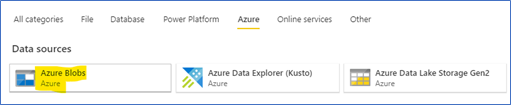
Since we are connecting from Power Query online, we will use the Azure Blob Storage Connector. This post by Melissa Coates describes how the connectors are both compatible with each other. As of this writing (9/29/2020) the Azure Blob Storage Connector is the only connector that allows connection via Access Key in Power Query Online, so we will use that in this demo. Filter the connectors by clicking on the Azure heading then select “Azure Blobs.”
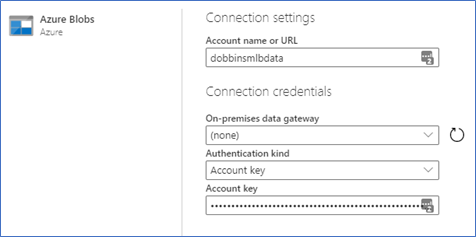
Now, we will need to retrieve some information from our storage account. In the storage account properties, go to “Properties” and copy the Primary endpoint for the Blob service. Then, add the container name to the end of it as shown below.
https://<<storage account name>>.blob.core.windows.net/<<container>>
https://dobbinsmlbdata.blob.core.windows.net/mlbdata
Go to the Access keys section and copy the value for Key 1 or 2, then paste it into the Power BI dataflow window, as shown below:
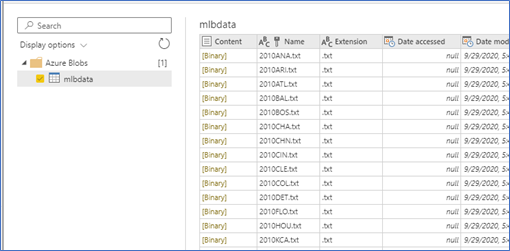
Click next, then select the mlbdata container to get a list of files.
Click the Transform data button to begin transforming the data.
We are going to do some interesting here, this dataflow will contain our reference data (ballparks, teams, players). We will store our event data in another dataflow. To do this, we need to filter the content Name column to only contain the following files: ballpark.csv, team.csv, and playerid.csv.
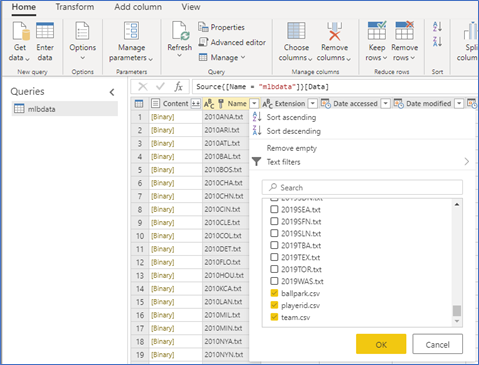
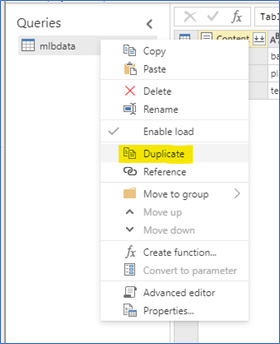
You may need to select the “load more” option in the filter to get them to show up. Click ok and the preview should now only contain those 3 files. Now, we want to duplicate (not reference) the file 3 times. Referencing the file would require a Power BI Premium capacity (Linked entity), but duplicating does not. Right-click on mlbdata under queries and select duplicate and repeat this process 3 times.
Now, rename these 3 new queries: Team, Ballpark, and Player. Right-click on the original mlbdata and uncheck the Enable load option. This disables this query from loading in Power BI when the dataflows are connected to Power BI. For each query, we will perform similar steps. The Team query steps are described below.
- Filter the name column to be “team.csv”
- Expand the content
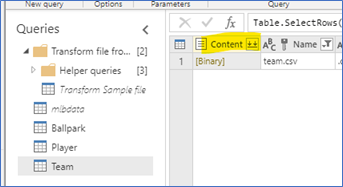
- Verify the data looks how we’d like it to look (correct types, etc.)
- Remove the Source.Name column
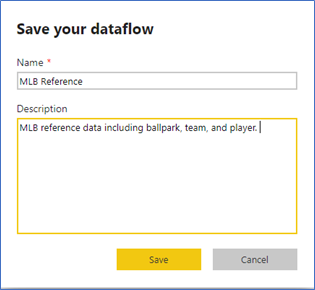
Then, repeat these steps for Ballpark and Player. Once you are done with each reference table, click Save and Close, select a name and click Save. When prompted, select “refresh now” to go ahead and populate the dataflow entities.
We will repeat the process for connecting to the Data Lake. Select New >> Dataflow in the workspace, connect to Azure blob service again, but this time filter out the reference files we just processed. This will leave only the play by play files. As described previously, there is a lot of information that can be gleaned from these files, but we are mainly interested in the games, players, and plays (outcomes). Perform the following steps to transform the data into something useful for Power BI analysis. Note that these steps are pseudo code and my full code is posted as a text file: click here.
- Filter out the reference files (ballpark, team, player) so the only files remaining are of the same play by play format
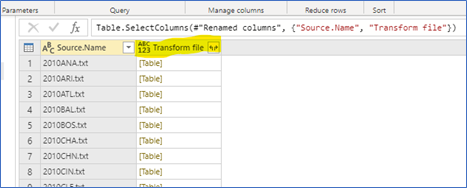
- Remove all columns except for Source.Name and Transform file (preview this cell to see that it contains the file contents of each team’s games in a single season)
- Expand the Transform file column
- Split the resulting column by comma delimiter, making sure that 7 columns are created after Source.Name
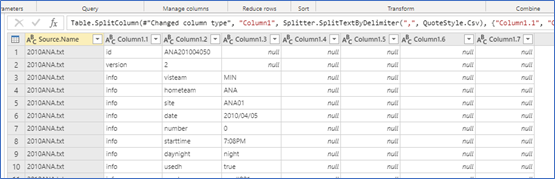
- Remove “start,” “sub” and “version” values from Column 1.1 (these are unnecessary data lines)
- Add the following conditional columns (these will be used for filtering and filling down later)
- VisitorTeam if Column 1.2 = “visteam” then populate with the value from Column 1.3
- HomeTeam if Column 1.2 = “hometeam” then populate with the value from Column 1.3
- Ballpark if Column 1.2 = “site” then populate with the value from Column 1.3
- Date if Column 1.2 = “date” then populate with value from Column 1.3
- Fill each of the new columns down (VisitorTeam, HomeTeam, and Ballpark)
- Change the Date column type to Date (Power BI will correctly interpret YYYY/MM/DD)
- Filter rows by Column 1.2 (only values = “play”)
- Remove Column 1.1
- Rename columns in this sequence after Source.Name: Inning, Home/Visitor, Player, PitchCount, PitchSequence, Outcome, VisitorTeam, HomeTeam, Ballpark, Date
- In Source.Name, replace “.txt” with nothing
- Split Source.Name by delimiter (first 4 characters, then the team name)
- Create a conditional field to store if the record comes from the home team. If Source.Name.2 = “HomeTeam” then yes, else no. Since we have records for all teams’ games, we can eliminate duplicates by choosing to only keep the home team. Filter this column to only store the home team records.
- Add an Index column (start from 1) and rename it to “ID.” This will make it easy to count the number of distinct values, etc.
- There are some additional steps you can take (included in my code), but they are mainly aesthetic, we have transformed the data to all plays in each season since 2010. Click Save and close and refresh the data when prompted.
Analyze the Data in Power BI
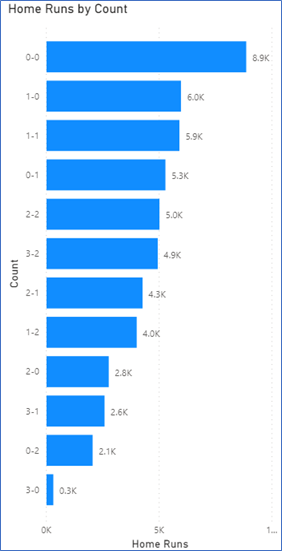
Now we have a very versatile dataflow of play by play data. This was relatively straightforward to implement. Now for the fun part, I will demonstrate a simple analysis (look at home runs by pitch-count). The question is, all home runs since 2010, which pitch counts are the most common?
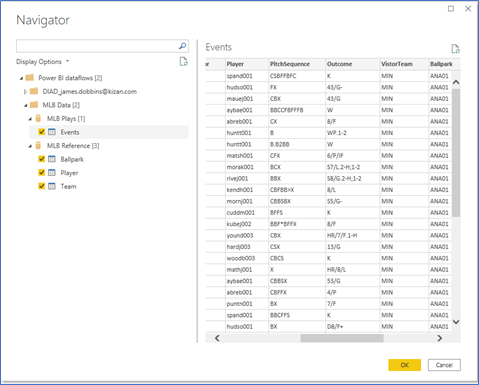
Open Power BI desktop and get data (Power BI Dataflows). Transform the data (open Power Query Editor) so we can filter the data before we load it. I am bringing in all of the entities we created in this demo.
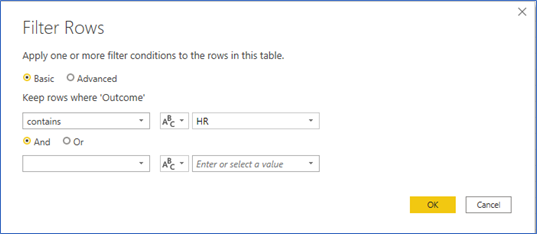
We only want to filter the Events table. The filter we will apply is where Outcome contains “HR.”
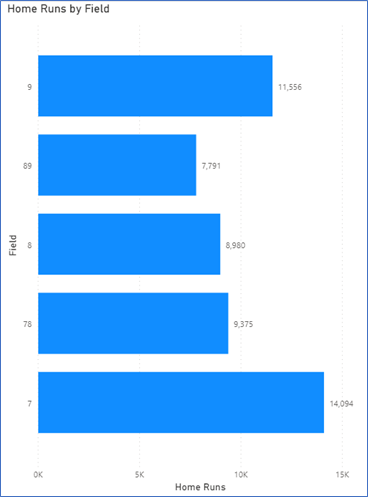
Another interesting analysis we can do is look at where the home runs are hit (left field, center field, left-center, etc.). Since the outcome field is delimited by the “/” character and the middle contains the field (7=left field, 78 = left center, 8 = center, 89= right-center, and 9 = right field), we can split the outcome field by “/” and analyze the resulting field.
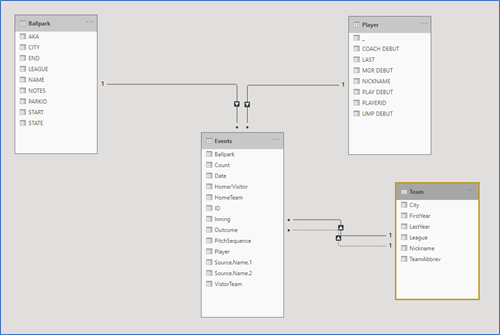
Click OK and load the data into Power BI. The relationships should be created as shown below. The teams table has a primary (HomeTeam) and secondary (VisitorTeam) relationship to the events table. The events table serves as the fact table in this star schema.
Since each record is a home run, we create a simple measure, Home Runs = DISTINCTCOUNT(Events[ID]).
Findings
There are some interesting visuals that can be produced with this data and many different ways to slice it and look at other baseball outcomes.
First, home runs by pitch count (I would have thought most home runs occur when pitchers fall behind in the count, but the most frequent is a hitter jumping on the first pitch). Perhaps pitchers are very cautious when they fall behind. 3 ball, no strike counts are the least common…these are definitely mistakes where the pitcher didn’t throw the ball where he intended and the batter had the green light to swing away.
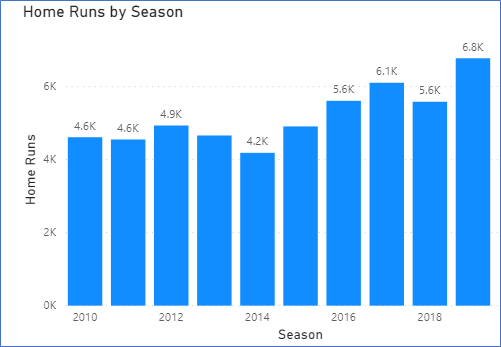
Home runs were up in 2019.
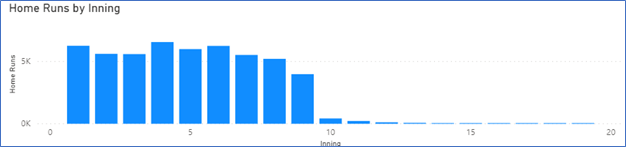
Specialty relievers have a dampening effect on home runs in late innings.
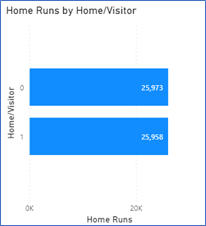
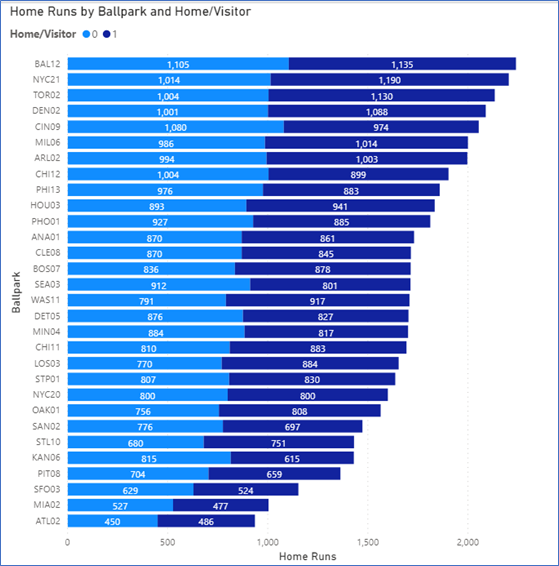
A remarkable balance between home and visiting team home runs (almost equal…0 = visiting team, 1 = home team).
Baltimore had more home runs in that park than any other ballpark (surprising, I would have thought Coors Field had the most at elevation in Denver, CO. The Yankees hit a lot of home runs and outslugged visitors there by 176 home runs (most in MLB).
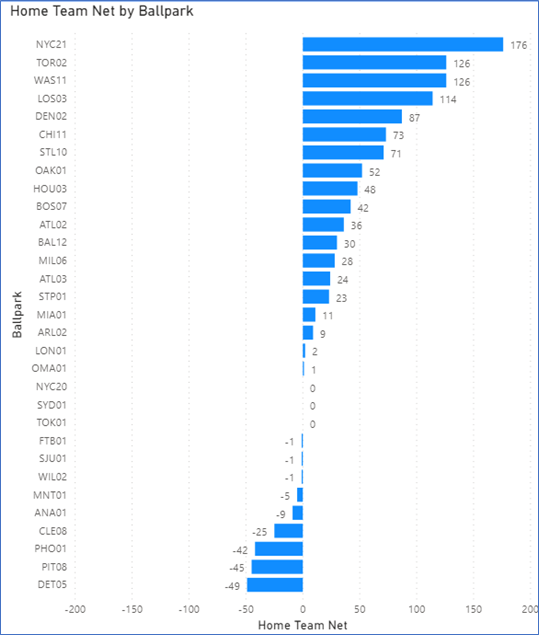
Creating a measure to calculate the home team home runs minus visitor home runs at each ballpark, Toronto is surprisingly in second place in taking advantage of their home field. The Royals were the most out-slugged at home (by 200), with Seattle (111) in second place for getting out-homered at home.
Finally, most home runs hit to left field or right field (includes down the line). This is not surprising, as a pulled home run has more power than hitting to the opposite field.
Summary
I hope this post was fun to follow and see the entire process from data source through transformation and finally visualization. I like to call the end process “walking around the dataset.” Power BI has numerous data connectors and Azure Data Lake Gen2 is a great place to store data for analysis later on by analysts and data scientists. The use case of MLB data shows how we can transform text files, combine them, and publish them in a dataflow that can be used for multiple analyses. These dataflows could be used to similarly analyze any number of baseball situations (double-plays, walks, late-inning situations, etc.).

KiZAN is a Microsoft National Solutions Provider with numerous gold and silver Microsoft competencies, including gold security and gold enterprise mobility management. Our primary offices are located in Louisville, KY, and Cincinnati, OH, with additional sales offices located in Tennessee, Indiana, Michigan, Pennsylvania, Florida, North Carolina, South Carolina, and Georgia.