
In today's fast-paced business landscape, staying ahead of the competition requires efficient and effective solutions. According to Microsoft’s Work Trend Index, nearly 70% of employee report that they don’t have sufficient time in the day to focus on “work”, with more time being spent Communicating than Creating.
Microsoft 365 Copilot is designed, with Microsoft’s cloud trust platform at its core, to allow for employees to both be more productive, reduce the time spent searching for information, performing mundane tasks, and other low-value activities.
Consuming XML web service data in Power BI
Index:
1 | 2 | 3 | 4 | 5 | 6 | 7 | 8 | 9 | 10 | 11 | Summary
Data wrangling is one of my favorite parts of working in data and analytics. Evan Gordon suggested I create a “weird data wrangling” series on working with various data formats in Power BI. This is a great idea! In this blog post, I will demonstrate how to use a web service that outputs towboat lockages in an XML format. We will break down the URL to use parameters for river and lock codes. I will also demonstrate the tweak needed so the web service can refresh in the Power BI service. This is an “intermediate-plus” post, so a basic knowledge of working with Power BI Desktop is assumed.
I previously worked for a company that operates towboats and barges on the US inland waterways. Locks and dams account for elevation changes in the waterway and can be major sources of delays when several towboats and barges queue up. I have included a picture of a towboat approaching a lock below. The barges are known as a “tow” and groups of barges will be “cut” (create smaller groups) to pass through the lock chamber then the tow will be put back together once the towboat comes through.
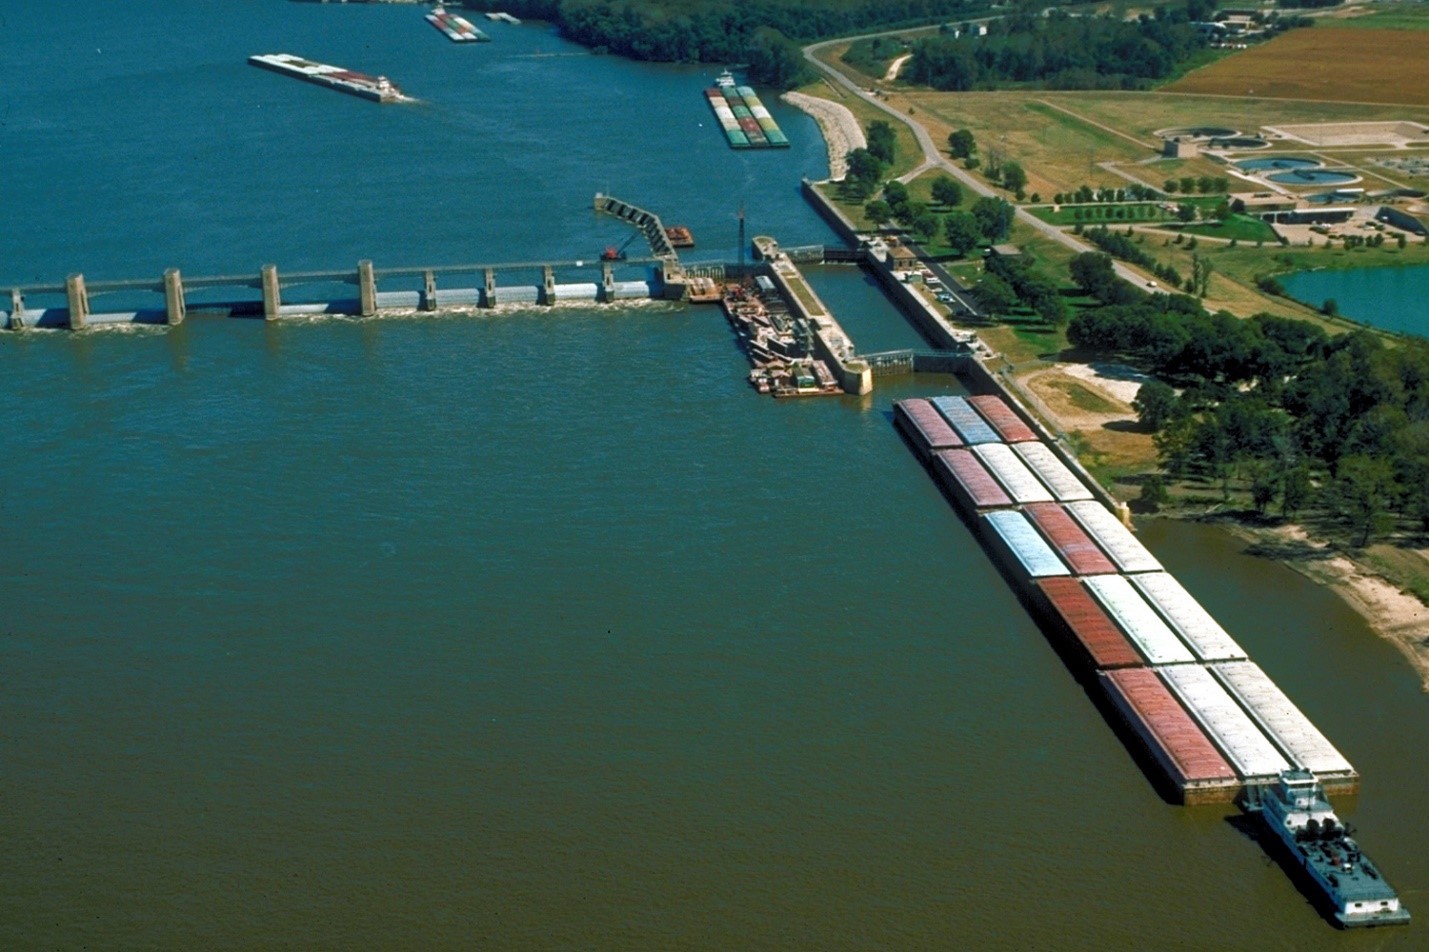
(Photo credit: US Army Corps of Engineers)
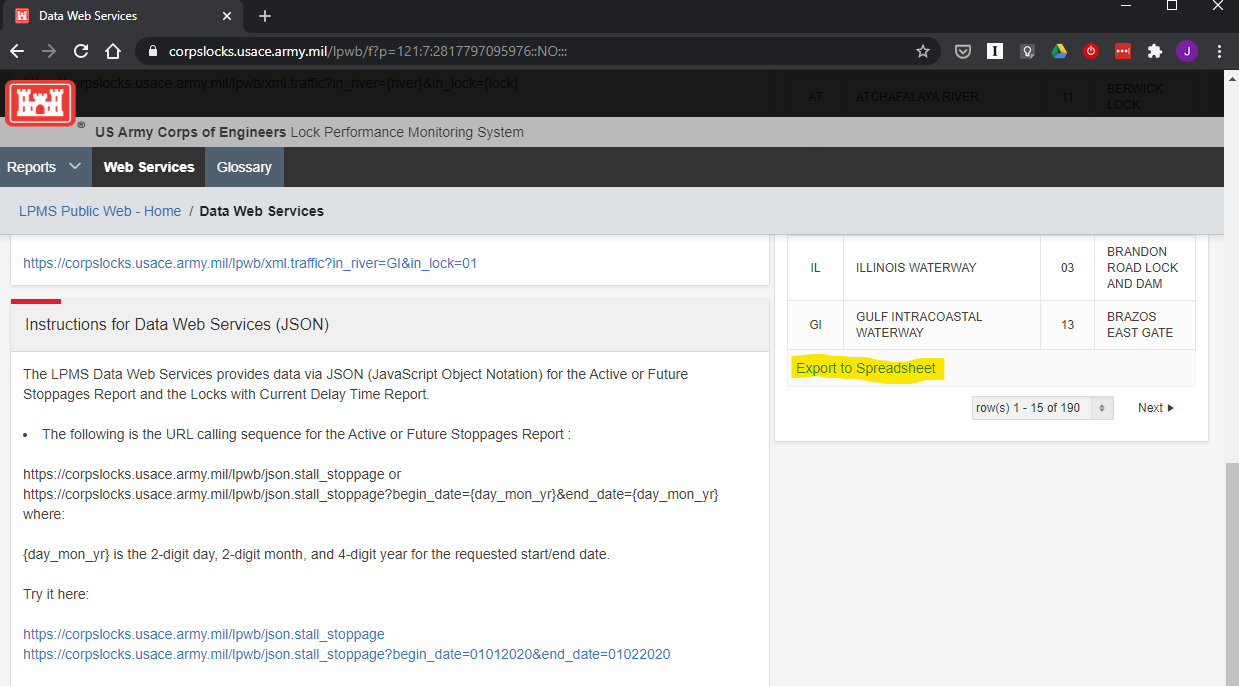
Lockages can be a costly source of delay when they have large queues, so it is best to know when this is happening. There is no need to hurry up and wait, burning unnecessary fuel if there are several boats queued up already. The US Army Corps of Engineers owns and operates these locks and dams and maintains a public website, Corpslocks (https://corpslocks.usace.army.mil/, click on “Data Web Services”) with several data web services.
One of these is the Lockqueues report, which contains the last 24 hours of lockages. This data is very valuable in knowing the conditions at locks throughout the inland waterways. In this blog post, we will walk through the steps to create a Power BI report that retrieves the data and can be refreshed once published to the Power BI service.
To prepare for this, we will need a list of all locks available in the service. This is found in a .csv file on the Data Web Services page. To get this, click the “Export to Spreadsheet” link below the table of locks.
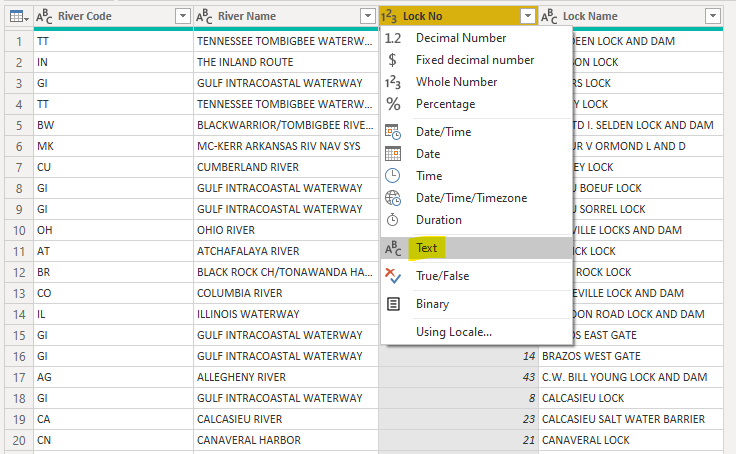
Import this into Power BI (Get data -> Text/CSV and select “Transform Data”) and examine the data in Power Query Editor. One issue is that “Lock No” comes in as a number data type. We need to change that to text since we need the leading zeros when we submit our web service request. This table will serve as our universe of locks from which to retrieve lockage data by passing each river and lock code to a custom Power Query function we will create later.
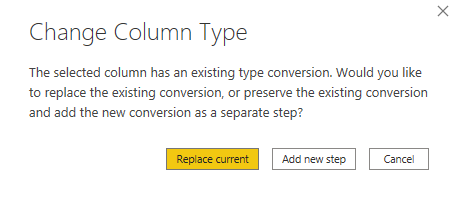
When you do this, you will see a prompt asking you to either replace the current step or insert a new one. We will select the “Replace current” option.
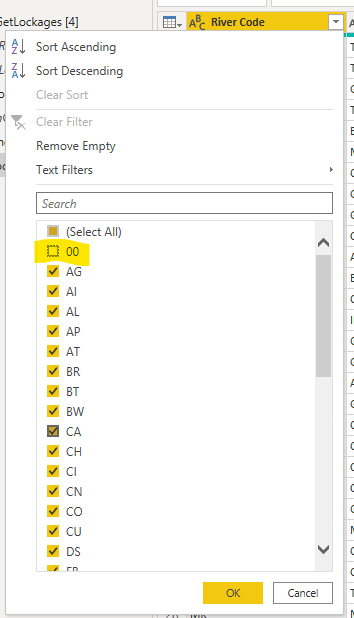
One last step before we start building the function is that we need to remove a dummy record. Filter the River Code column and uncheck the “00” value and click OK.
Now, we need to define the river and lock parameters to pass values to the web service. Click on “Manage Parameters” in Power Query Editor and create 2 new parameters as defined below:
|
Name |
Type |
Current Value |
|
pRiver |
Text |
GI |
|
pLock |
Text |
01 |
The dialog should resemble the following image.
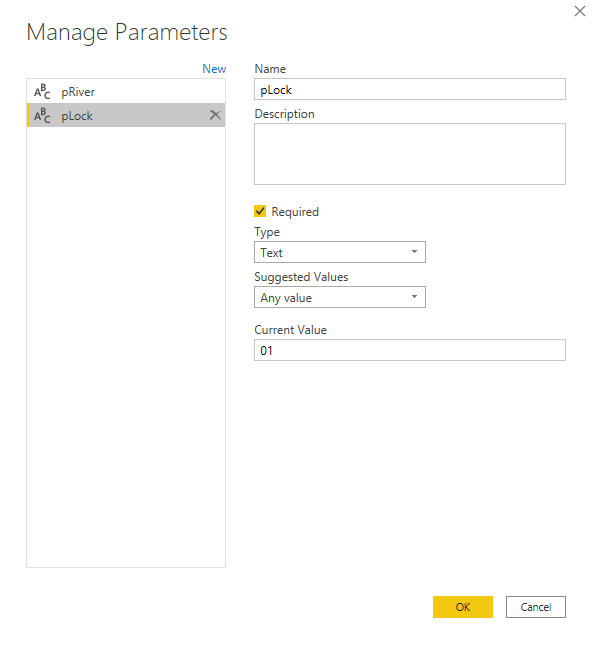
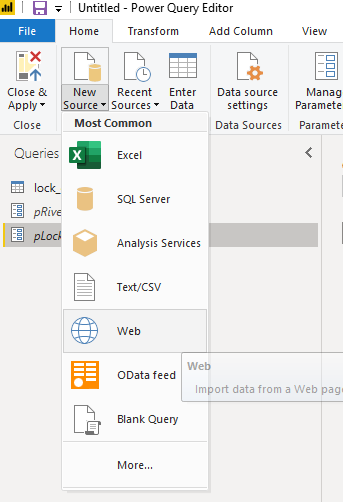
Click OK. Now we will define the web service as a new data source.
Click New Source -> Web.
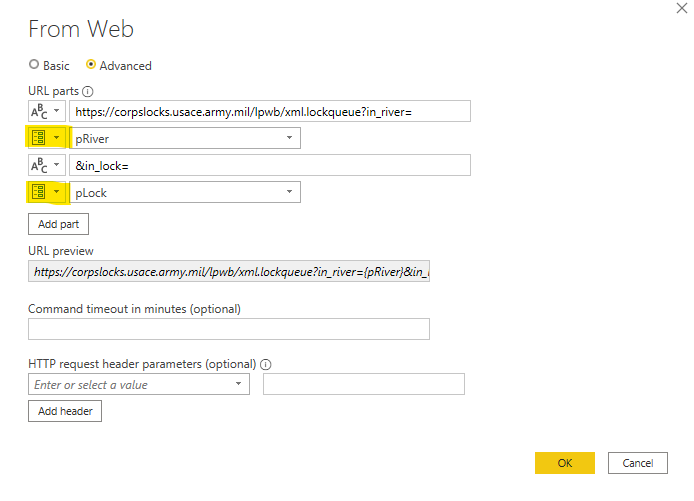
In the “From Web” dialog, select the “Advanced” option and we will break the following URL into four parts, substituting parameters where necessary:
https://corpslocks.usace.army.mil/lpwb/xml.lockqueue?in_river=GI&in_lock=01
Click “Add part” until there are 4 URL parts, then select parameter (highlighted) to select pRiver and pLock. Each part will be concatenated with the next to make up a full string (the URL to call). This will be dynamic, and we will substitute values for pRiver and pLock from the .csv file we imported earlier. The dialog should resemble the following image:
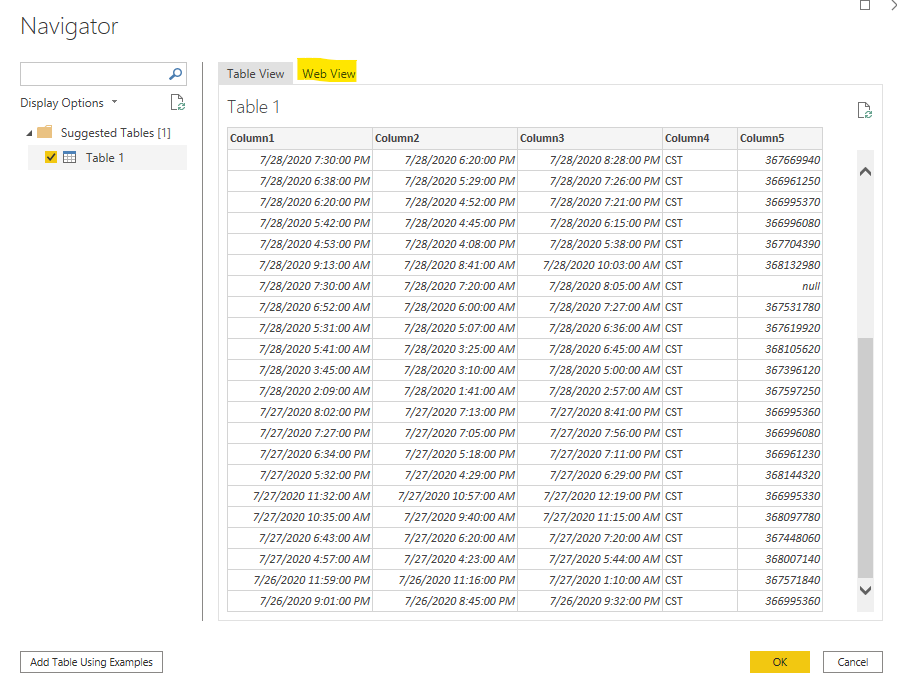
Click OK and Power Query Editor will attempt to render a preview of the data in the service. Click on “Table 1” under Suggested Tables. Unfortunately, this is a temporary disappointment since the table only contains 3 datetime fields, a text field, and a number field. We are expecting a lot more information from the web service (e.g., vessel number, name, direction, number of barges, etc.).
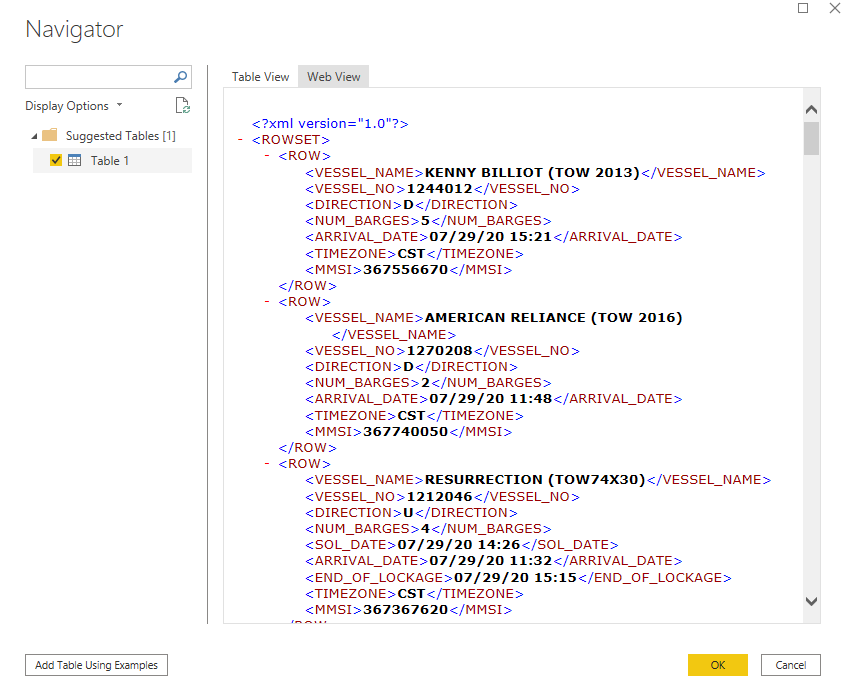
Click on the Web View tab (enable the preview if prompted) and now we see what we were expecting, lockage data in XML format. Click OK to import the data.
When we do this, we get the imported data from Table 1 (the disappointing preview). We can see what happened in the Query Settings (Applied Steps), Power BI tried to interpret the data as HTML and not as XML.
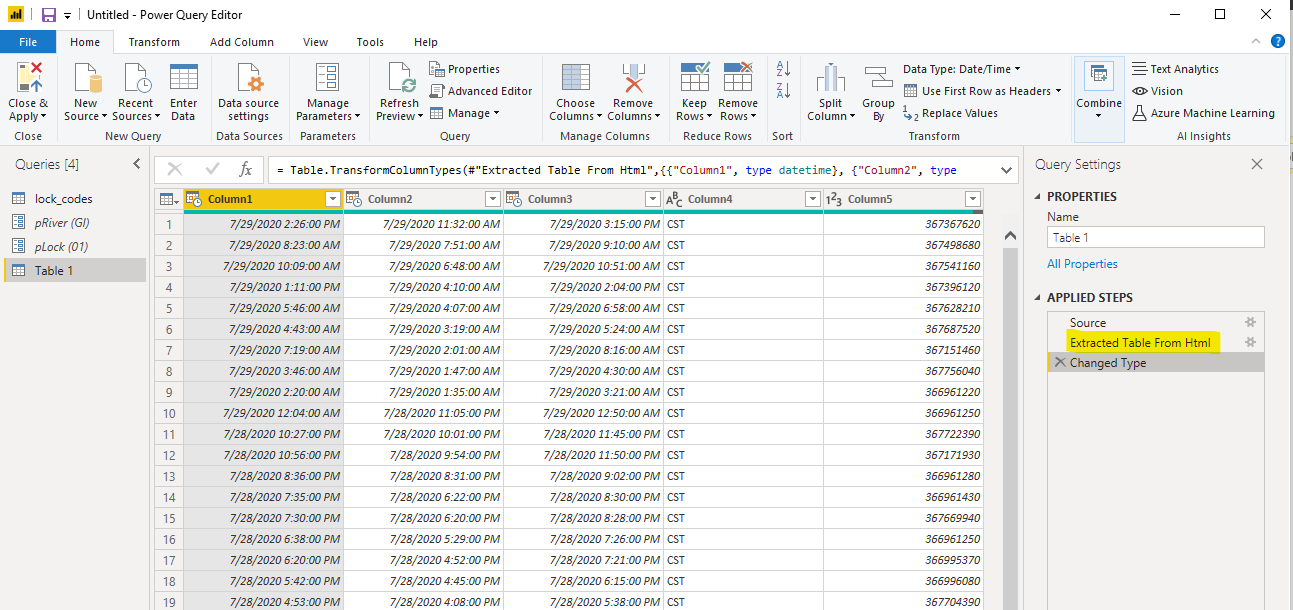
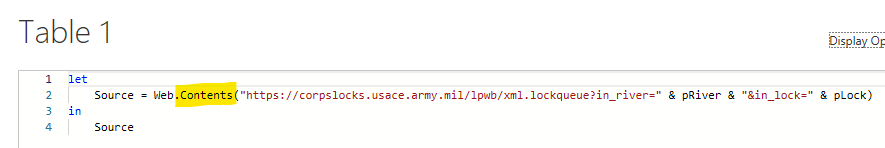
No problem! Delete the “Changed Type” and the “Extracted Table from Html” steps to preview the data at its source (select the “Source” step in the Query Settings dialog under Applied Steps). Now we can see why Power BI thought it was HTML (look at the first line before the row XML begins). The Source step uses the Web.BrowserContents function, but it will be best if we are working with binary data retrieved using the Web.Contents function rather than HTML. To make this change, open Advanced Editor and rename the Web.BrowserContents call to Web.Contents. The step’s code should read as follows:
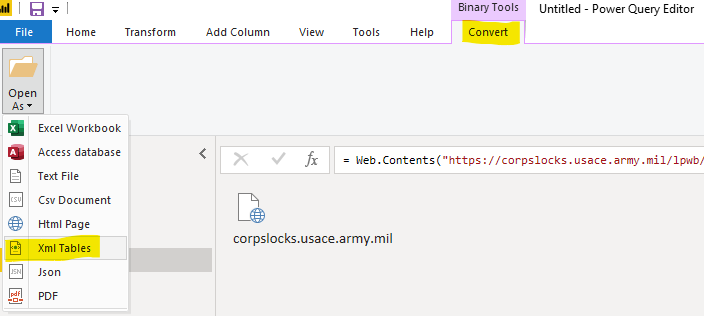
Click Done. Now we see there is a binary object and a new tab named “Binary Tools.” Click on that tab and notice the “Convert” group and select “Open As – Xml Tables.”
Click on the Table cell to preview the data…this is what we were expecting!
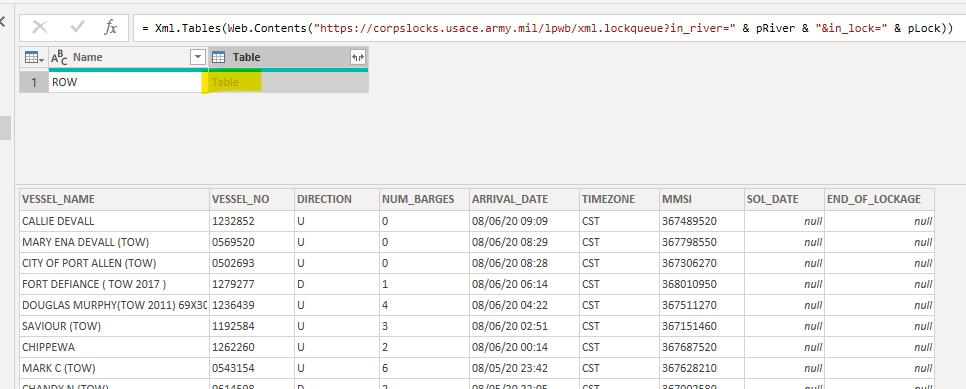
Now we need to expand the table, but first, remove the “Name” column as we do not need it. Then click the button to the right of “Table” in the column header to expand the table. Uncheck the “Use original column names as prefix” option as shown below.
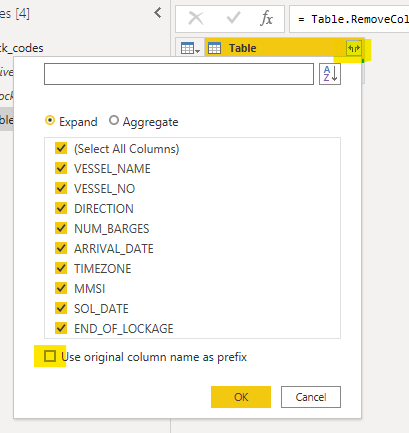
Click OK and we will see data on individual vessel lockages for Port Allen Lock (lock 01) on the Gulf Intracoastal Waterway (river GI). Note that each column type is the dangerous “ABC 123” (any) type.
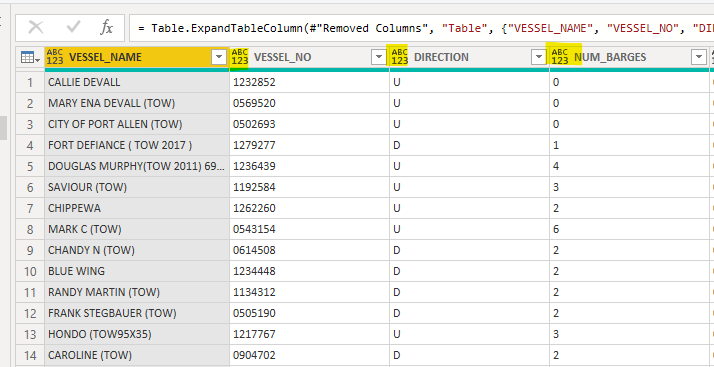
Change the types as shown in the following table (right-click the column, select “Change Type” and select the appropriate type):
|
Column Name |
Data Type |
|
VESSEL_NAME |
text |
|
VESSEL_NO |
text |
|
DIRECTION |
text |
|
NUM_BARGES |
int |
|
ARRIVAL_DATE |
datetime |
|
TIMEZONE |
text |
|
MMSI |
int |
|
SOL_DATE |
datetime |
|
END_OF_LOCKAGE |
datetime |
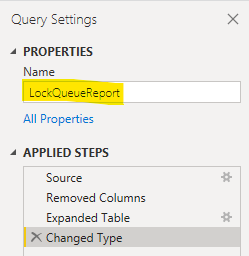
The table has the non-descript name of “Table 1.” Rename this to LockQueueReport.
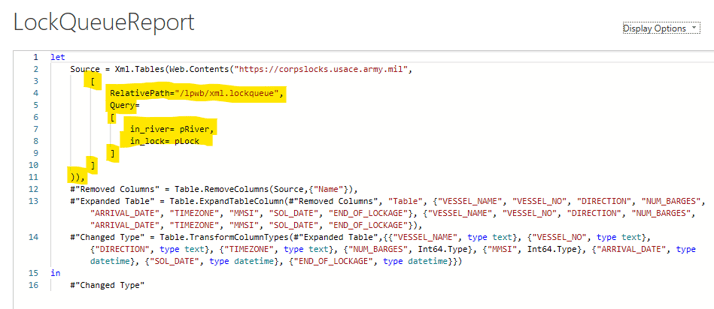
Now we need to make a small change that will enable this data source to refresh when published to the Power BI Service. Chris Webb’s BI Blog has a great blog post that helped me figure this out. The entire post is worth a read, but the short story is that the service needs a non-dynamic URL (i.e., no parameter substitution, etc.) to evaluate against when it attempts to retrieve data. To that end, we will utilize the base URL of the service with the “RelativePath” option of the Web.Contents function. Open Advanced Editor and make the highlighted change to the Source step:
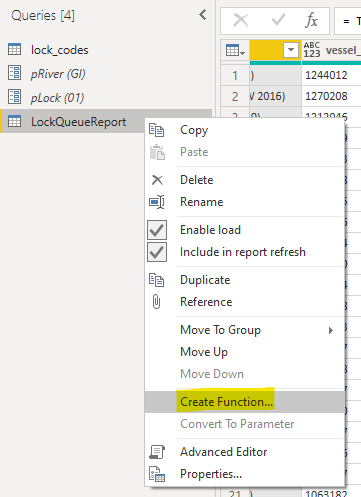
What we have built so far is great for getting data for one lock on one river but remember that we created the parameters and can call them from a table of rivers and locks. We need to convert this table into a function.
Right-click on the LockQueueReport table and select “Create Function.”
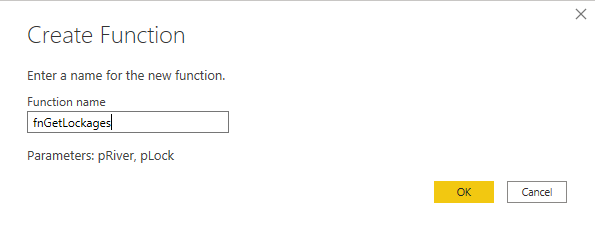
Give it a name, “fnGetLockages” has a nice ring to it, and click OK.
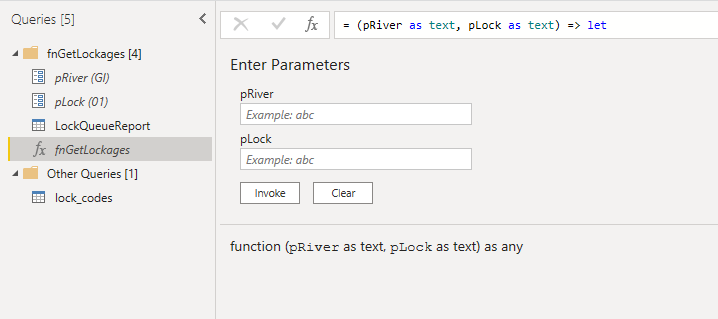
Now, we have a function we can call for any number of locks we would like. You will see a new folder created with all the objects necessary for the function (the river and lock parameters, the function, and the query upon which the function is based).
We will create a copy of the lock_codes table to use in invoking the new function (right-click lock_codes and select “Duplicate”) and rename this to LockageData. We do not need the River Name and Lock Name fields in this table, so remove them. We will store river and lock names once in the lock_codes dimension table. To get the lockages we will add a column by calling the custom function. The column type will be a table, so we will have to expand the values once the function is called.
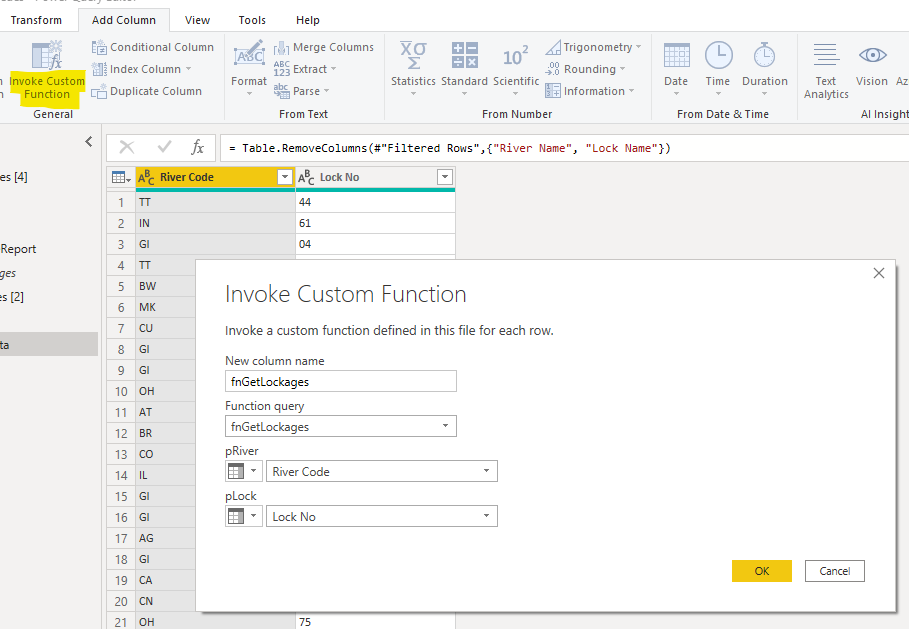
Calling the function for all 190 locks would take some time, so for purposes of this demo, we will filter to include only the 19 locks on the Ohio River (River Code = ‘OH’). Click on the LockageData query, activate the “Add Column” tab, and select “Invoke Custom Function.” Select the fnGetLockages function from the drop-down and accept the new column name of fnGetLockages. Select River Code and Lock No fields for the parameter values of pRiver and pLock, respectively, and click OK. Set the privacy levels for this data set to public if you are prompted.
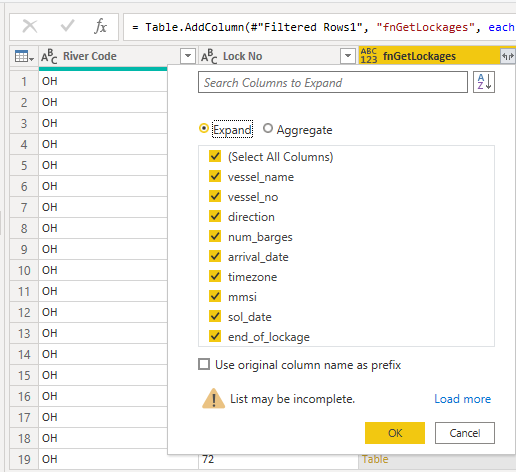
A new column, fnGetLockages, will appear with a set of records for each lock. This needs to be expanded. Click the in the column header to expand the table. Note that there are 2 options, expand and aggregate. Select aggregate to see the options available. Rather than import individual records, this option would compute aggregations based on columns (e.g., sum of the num_barges field, count vessel_name values, etc.). Select the expand option, uncheck the “Use original column name as prefix” option, and click OK.
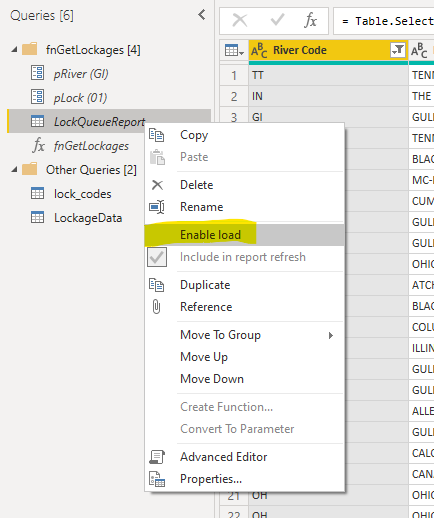
After expanding the table, the column data types will need to be changed from “Any” (ABC 123) to the proper types. Before closing and applying the data transformation, we should disable load for the LockQueueReport table. Right-click on the table and uncheck the “Enable Load” option. Click “Continue” in the Possible Data Loss Warning dialog, there should be no visuals that depend on this table.
The LockQueueReport exists in Power Query Editor as the definition of the fnGetLockages function. You can change the code of the function (data transformation) by modifying the steps in the LockQueueReport table. The only tables we want to load in the report are lock_codes and LockageData.
Click “Close and Apply” to load the data in the report.
In order to relate the tables, we will need to create a composite key by concatenating the River Code and Lock No values together as a new “RiverLock” field. Right-click lock_codes and select “New Column” and enter the following text in the Formula bar:
RiverLock = lock_codes[River Code] & lock_codes[Lock No]
Similarly, we need this column in the LockageData table so follow the same steps with the code below:
RiverLock = LockageData[River Code] & LockageData[Lock No]
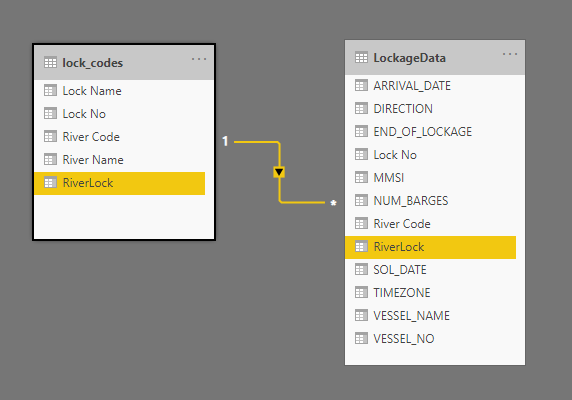
Proceed to the modeling tab and drag one of the RiverLock columns onto the same-named column in the other table. This will create a one-to-many relationship from lock_codes to LockageData as shown below.
This is a rich dataset, and many useful calculations can be produced. As an example, if the “SOL_DATE” (start of lockage datetime) is null, that means the boat has arrived but not yet started its lockage. A simple visualization of locks and distinct counts of MMSI numbers (unique AIS numbers for vessels) broken out by direction is presented below.
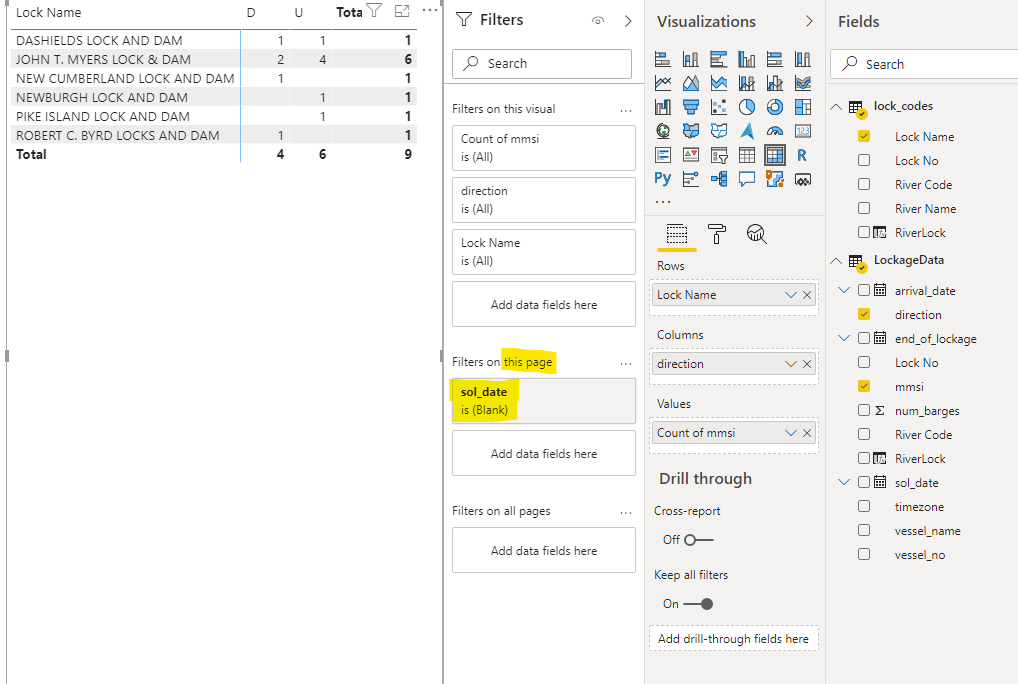
Note that the page has filters to only show records where SOL_DATE is (Blank). Other calculations of interest are time differences between ARRIVAL_DATE and SOL_DATE to compute average delay time across several dimensions (date/time, direction, river, lock, etc.).
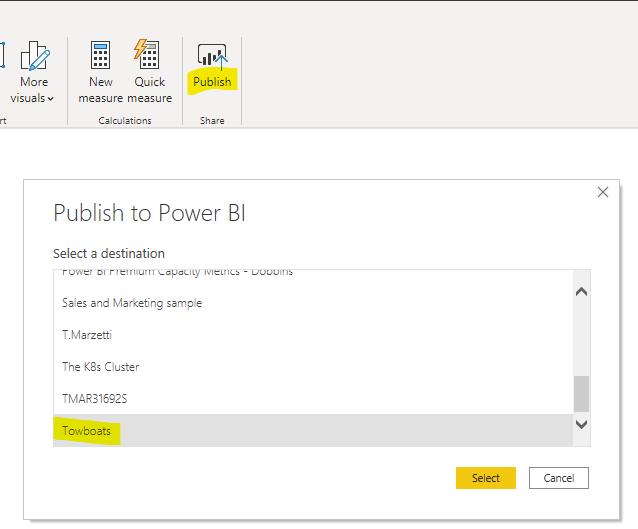
The next steps include publishing the report to the Power BI service and configuring a refresh. I have a workspace called “Towboats” where I will publish my report (named “Ohio River Lockqueues”). To publish the report, in Power BI desktop, click the publish button and select the desired workspace.
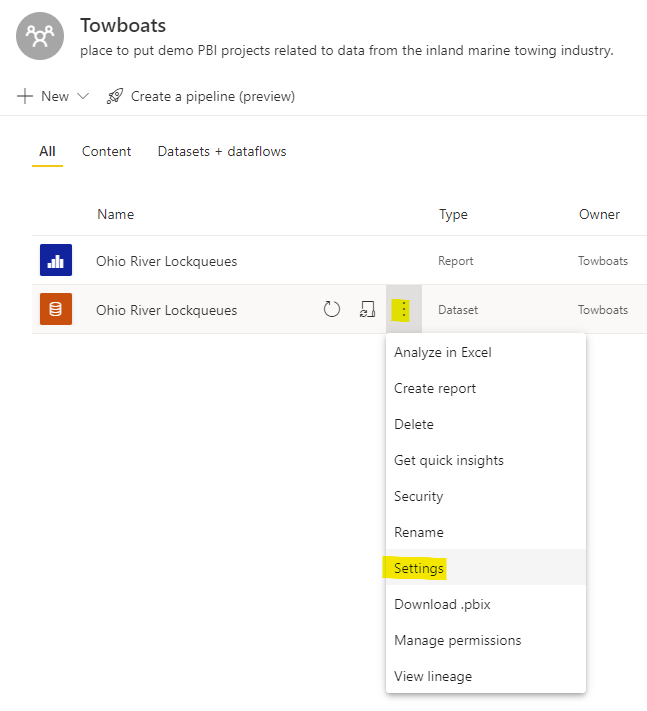
Now that the report is published, we need to check the settings of the datasource. To do that, go to the service (http://app.powerbi.com) and navigate to the workspace where the report was published. Then, click on the ellipsis next to the dataset and select “Settings.”
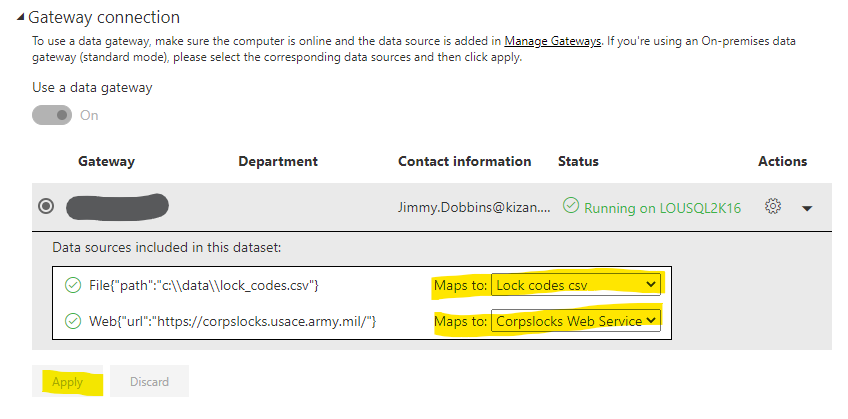
Expand the gateway connection section and examine the data sources included in the dataset and their connections (currently not configured correctly):
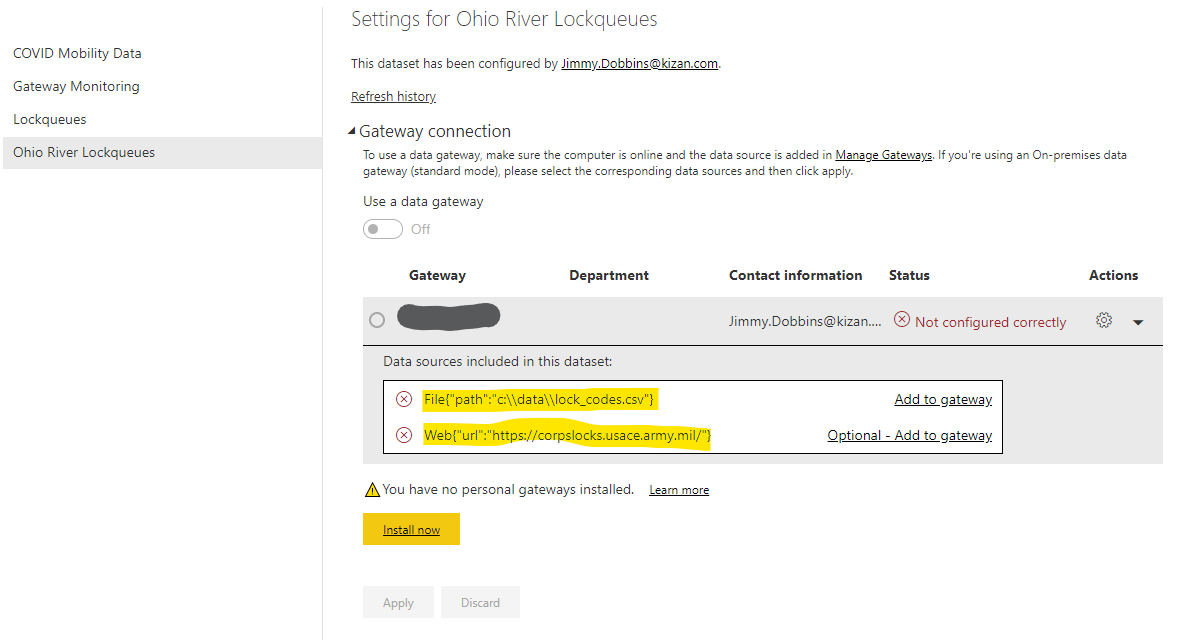
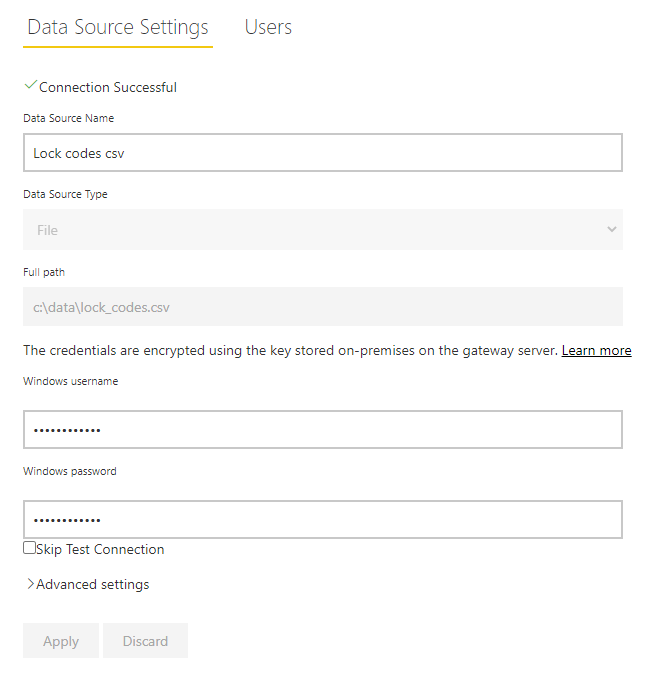
We need to create two entries, one for the Corpslocks web service and another for the lock_codes.csv file. The easiest way to do this is to follow the “Add to gateway” links. My completed entries look as follows, first lock_codes.csv:
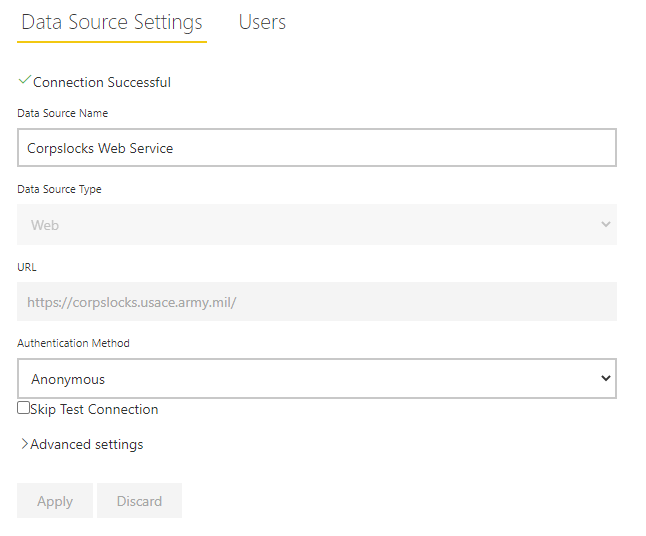
then the Corpslocks Web Service:
Return to the dataset, click settings, and expand the gateway selection. Then, select the newly created gateway entries and click apply.
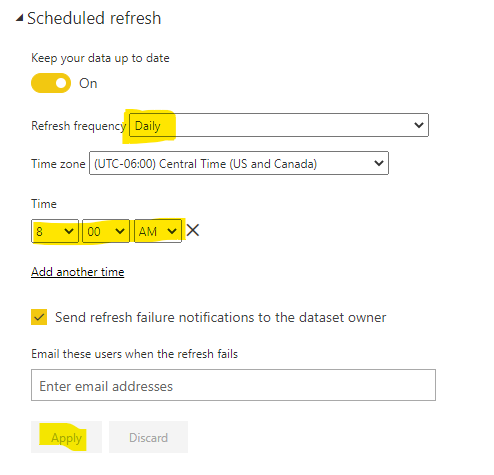
Expand the Scheduled Refresh section and check the option to keep your data up to date. Then select an appropriate frequency and click apply. My settings are below:
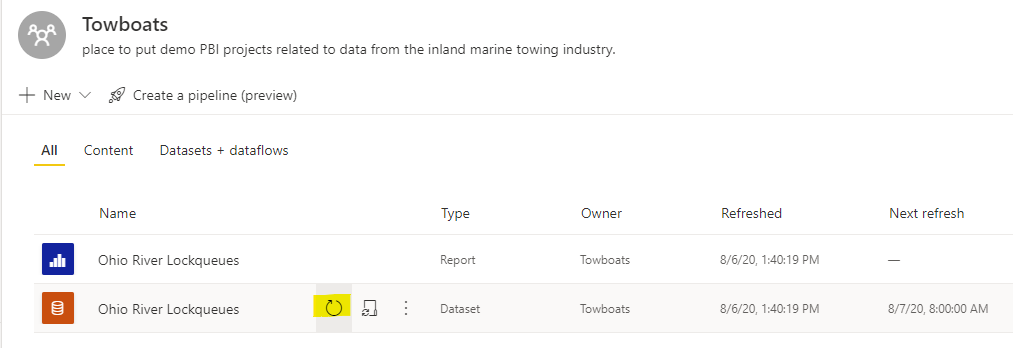
A good practice is to perform a manual refresh to test the connection configuration.
I hope this blog post is useful and highlights Power Query’s capabilities to extract XML-formatted data from a web service, as well as how to parameterize the function. Note that similar steps could be applied to HTML, JSON, and other types of formats. Special thanks to Chris Webb’s blog for the notes on the RelativePath parameter in Web.Contents.
SQL Server Health Check
Having SQL Server issues or want to make sure you are ready to upgrade?


KiZAN is a Microsoft National Solutions Provider with numerous gold and silver Microsoft competencies, including gold data analytics. Our primary offices are located in Louisville, KY, and Cincinnati, OH, with additional sales offices located in Tennessee, Indiana, Michigan, Pennsylvania, Florida, North Carolina, South Carolina, and Georgia.