

In today's fast-paced business landscape, staying ahead of the competition requires efficient and effective solutions. According to Microsoft’s Work Trend Index, nearly 70% of employee report that they don’t have sufficient time in the day to focus on “work”, with more time being spent Communicating than Creating.
Microsoft 365 Copilot is designed, with Microsoft’s cloud trust platform at its core, to allow for employees to both be more productive, reduce the time spent searching for information, performing mundane tasks, and other low-value activities.
Power BI
With more and more people and companies adopting Power BI, more datasets and reports are being developed than ever before. Because of this, I figured now is a great time to share some of the pain that I have collected over the last 5 years of working with Power BI. This list is certainly not comprehensive; these only represent the most common recommendations that I have when reviewing development practices with our customers.
1. You should be using fewer datasets
When you publish the same dataset with a slightly different report on it, you introduce (at the very least) more work for yourself when updating anything in the dataset and (most likely) you are going to introduce inconsistencies between the datasets.
This is easily remedied by either:
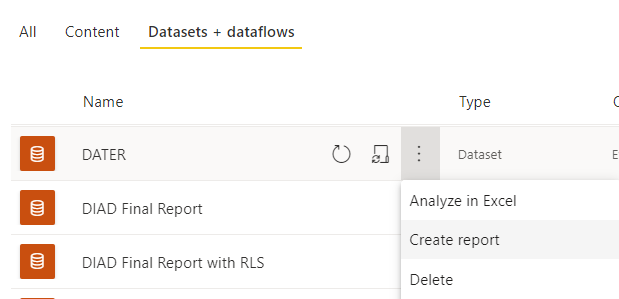
Connecting to the dataset that you already published when creating your next report
Or
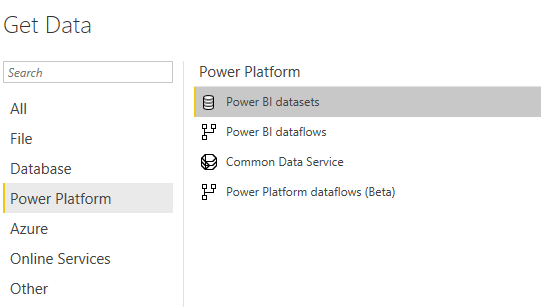
Developing your future reports using the web portal:
2. You should be using measure folders
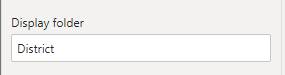
Folders to organize measures in tables make it easier for new people to pick up and start using the dataset you made. It also allows for logical groupings of metrics to make report development more efficient. You can assign measures to folders in the model view of Power BI desktop by clicking on a measure and entering the name of the folder you want to create in the "Display Folder" text box:
Once you have a folder entered, it will show up in the "Fields" section:

3. You should be using variables in DAX
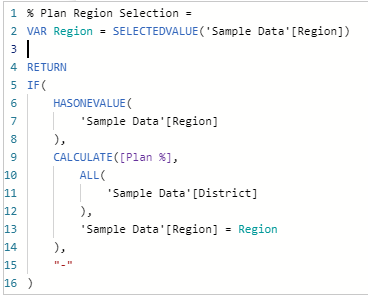
Variables make it easier to create more complex measures and let you do more advanced conditional statements. They also can improve performance by allowing you to define logic once and reuse it in multiple places. For example, the following code uses a variable to only show data for a single selected value in "Region":
4. You should be using M to calculate columns more often
In short, M is great for transformations, and DAX is great at calculations. Columns defined in the query editor with M are calculated at the time of refresh, and columns written in DAX are calculated in memory after the data has been loaded. This means that DAX columns can be less performant than M columns. So, for things such as concatenating a first and last name to create a full name column, using the Query Editor makes more sense since that doesn’t require a lot of logic and won't vary when viewing the report. However, for uses like Revenue Year to Date, it's possible to do in M but would require much more code to accomplish, and would be static after being refreshed, so it would make more sense to use DAX.
5. You should be using fewer table visuals
Power BI isn't excel and shouldn’t have a page that is just a few filters and a table. If this is intended to be viewed by users then its most likely sub-optimal and could be split into a few charts to make it easier to digest and identify trends/outliers. Or, if you are developing it as a data export page, that indicates that the report doesn’t include all the metrics that users need. Rather, you should provide those metrics for them, or allow them to connect to the dataset and create their own reports.
Hopefully, this list will help you with your future Power BI projects. If you have additional items to add to this list, or suggestions for other topics, please let us know.

KiZAN is a Microsoft National Solutions Provider with numerous gold and silver Microsoft competencies, including gold data analytics. Our primary offices are located in Louisville, KY, and Cincinnati, OH, with additional sales offices located in Tennessee, Indiana, Michigan, Pennsylvania, Florida, North Carolina, South Carolina, and Georgia.