

In today's fast-paced business landscape, staying ahead of the competition requires efficient and effective solutions. According to Microsoft’s Work Trend Index, nearly 70% of employee report that they don’t have sufficient time in the day to focus on “work”, with more time being spent Communicating than Creating.
Microsoft 365 Copilot is designed, with Microsoft’s cloud trust platform at its core, to allow for employees to both be more productive, reduce the time spent searching for information, performing mundane tasks, and other low-value activities.
One of the biggest challenges for anyone starting in the field of data analytics is finding large enough datasets to practice data transformations. Despite the abundance of resources available on the internet for learning about tools like Power BI and their capabilities, it can be difficult to put that knowledge into practice without access to proper datasets. However, there is a simple solution that provides a wealth of data to work with – Takeout.
Takeout
Takeout (takeout.google.com) is a service offered by Google that allows users to download data from a variety of Google products. To use Takeout, simply log in with your Gmail account and you will be presented with a list of products that Google tracks data on. For this example, I will be using my YouTube watch history as the base dataset for data analysis and visualization. I downloaded my data as a JSON file, but you can also download data such as location and search history.
Data Transformation
Once the data has been downloaded, the next step is to perform transformations on it to make it usable for data analysis and visualization. This process is easily accomplished using Power Query within Power BI. The transformations typically include cleaning the data by removing irrelevant columns, renaming columns to make them more meaningful, and aggregating the data to summarize it in a way that is more useful for analysis.
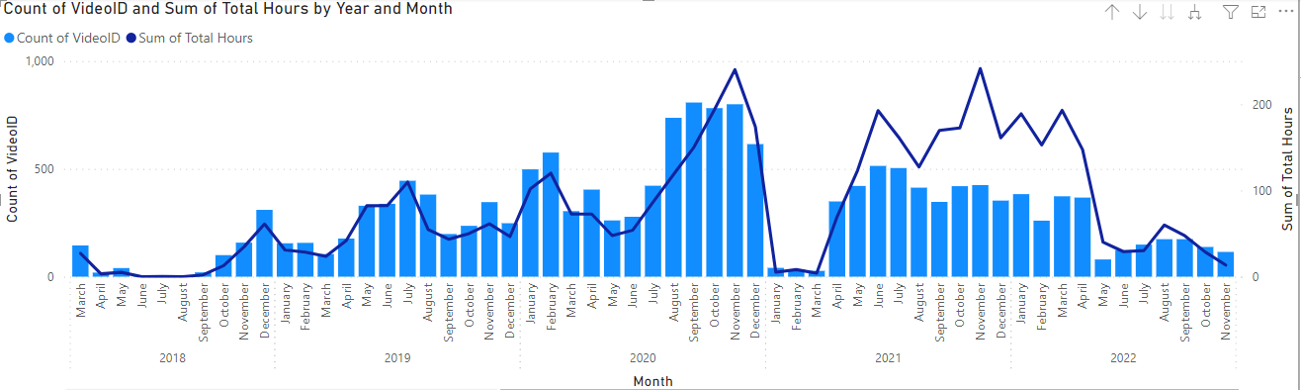
With the transformed data, you can then create several meaningful visuals to provide insights into your YouTube viewing habits. For example, you can create a bar chart that compares the total number of videos watched to the total hours consumed per month.
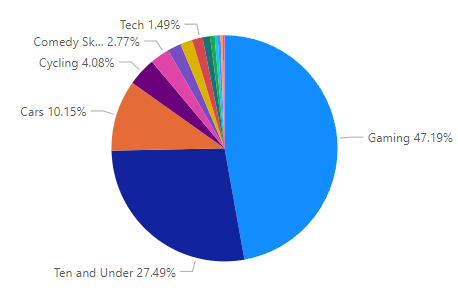
Pie charts can also be used to show the breakdown of video genres watched, allowing you to see which types of videos you are most interested in.
Power BI Dashboards
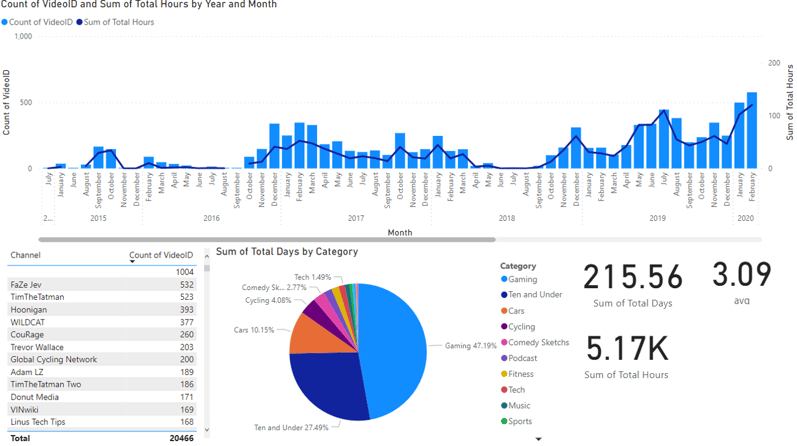
Power BI allows you to create interactive dashboards that allow you to explore your YouTube viewing habits in more detail. You can create interactive visuals that allow you to drill down into your data and view it at various levels of detail, such as by day, week, or month. One of the benefits of using Power BI is the ability to interact with live datasets, which can be used to practice your data transformation skills and create meaningful visuals with data that is constantly updated.
In this case, Takeout did not give information on how long each video was watched. To find the aggregate amount of time spent on YouTube, I had to use an API call to YouTube itself. Power BI made the connection to the rest of the data by using the URL as the key, making it a seamless process.
Conclusion
In conclusion, Takeout is an excellent resource for anyone starting in Power BI who is looking for large datasets to practice their skills. The data is easy to use in Power BI, and with nothing more than a Gmail account, you can get started with a wealth of data to work with. Whether you're looking to gain insights into your YouTube viewing habits or practice your data transformation skills, Takeout is a convenient and accessible platform for getting started in Power BI.
Azure Synapse Analytics and Power BI
Unlock the full business value of your data with the best of analytics from Microsoft.
Learn More

KiZAN is a Microsoft National Solutions Provider with numerous gold and silver Microsoft competencies, including gold data analytics. Our primary offices are located in Louisville, KY, and Cincinnati, OH, with additional sales offices located in Tennessee, Indiana, Michigan, Pennsylvania, Florida, North Carolina, South Carolina, Georgia and Texas.