

In today's fast-paced business landscape, staying ahead of the competition requires efficient and effective solutions. According to Microsoft’s Work Trend Index, nearly 70% of employee report that they don’t have sufficient time in the day to focus on “work”, with more time being spent Communicating than Creating.
Microsoft 365 Copilot is designed, with Microsoft’s cloud trust platform at its core, to allow for employees to both be more productive, reduce the time spent searching for information, performing mundane tasks, and other low-value activities.
Power BI
In this blog post, I will continue the series on wild data sourcing strategies.
In my quest to find things that are needlessly hard to occupy my free time, I stumbled across https://spotifycharts.com/ which is Spotify’s list of popular songs. So, after digging around in it for a bit and pulling the CSV into Power BI to see what I could do with it I realized that this data only gets interesting if you look at it over time. With this realization, I set out to create a dataset that would allow me to pull data from any date range. And that is the topic for today’s blog post, an in-depth review of the process I went through to create the dataset.
Before we get ahead of ourselves, let’s start with the general concept/usage I was going for. I want to be able to define a date range and pull all the top songs from that range. So let’s take a look at how we could go about doing this.
Firstly let's dig into the structure of the data pull from Spotify Charts:

When navigating to https://spotifycharts.com/ it defaults to the current day, but if we select a different date from the drop-down the URL changes:

It appends the date selected in YYYY-MM-DD format, the Regional filter, and the selection of daily or weekly to the URL. GREAT NEWS! This means that we will be able to pass in a date and get back a list of songs. Also, if we hover over the "DOWNLOAD TO CSV" button we can see that it is using the same URL with /download appended to the end:

Now that we have looked at how we can manipulate our data source, let’s get into Power BI and start figuring out how to import it for analysis.
As stated in the intro, we are looking to create something that will let us define a date range and pull all the data from that range. While it would be easier to just define one date and a number of days as a duration, that isn't as user friendly as providing two dates to select as a range. So, since I enjoy making things harder on myself, that is the pattern that I followed.
With this pattern in mind, we are going to define two date parameters, StartDate and EndDate:
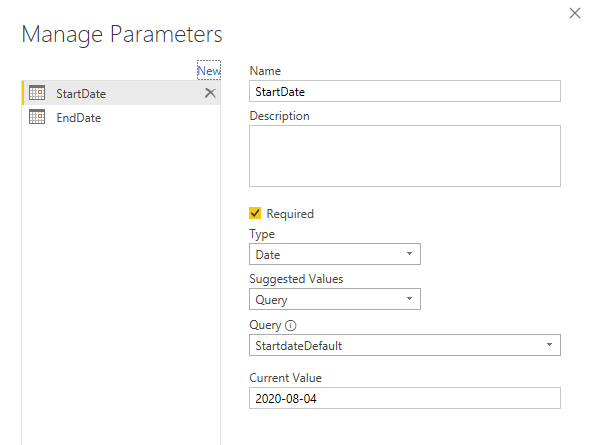
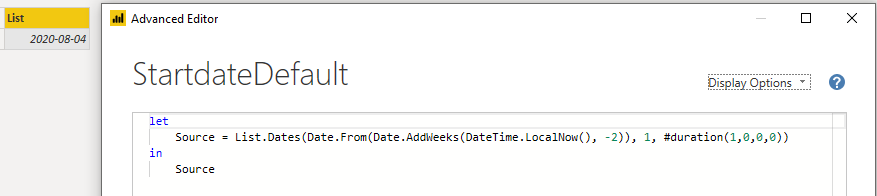
As you can see in both of these parameters, a default value is set with a query. For StartDate it is two weeks ago:
And for EndDate it is set to the previous day:
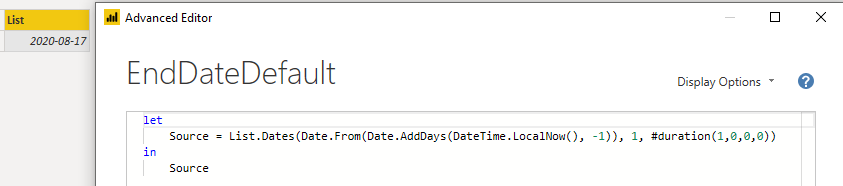
This is accomplished by getting the current day with the DateTime.LocalNow() Power Query M Function and then using Date.AddDays or Date.AddWeeks to add a negative number. (No prizes for guessing when this article was written ;) )
Now to the fun part.
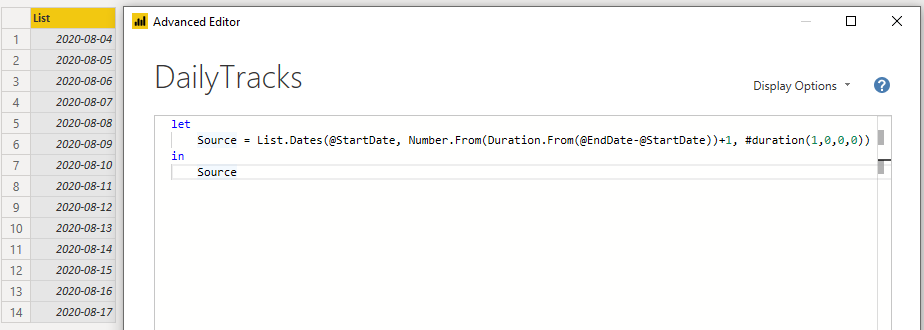
We need to use our two date parameters to generate a list of dates. This part took me a bit of time to figure out, noodling through the M documentation. However, I eventually landed on using Duration.From wrapped in Number.From to get first get the duration, then the number of days between the start and end. "With that number, we can use List.Dates and provide the StartDate parameter as our start date to list the same number of days that were between our start and end:"
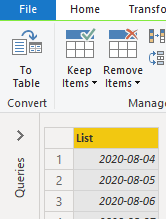
Then, we convert the list to a table using the handy button in the ribbon:
With our dates listed out, we can use them to start creating our URL to pull our data from. To save you from having to go through the pain I did getting this to work, I’ll just show you the code I use to parse the date and generate the URL:
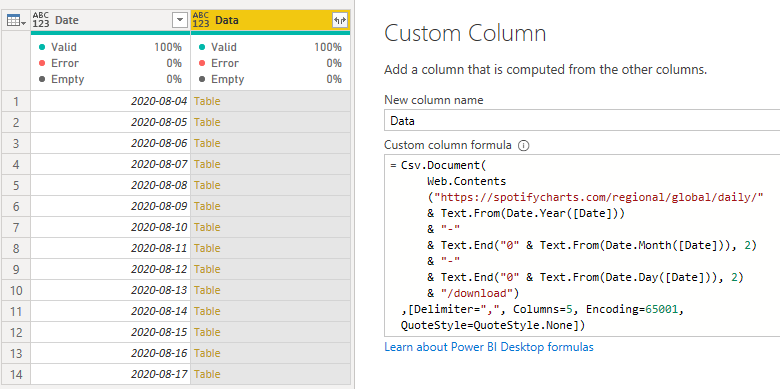
Basically, the way that M deals with Dates is kinda weird for what we are doing here because while it shows the date as "08" for month and "04" for day in the first row, when we use the Date.Month it only returns "8". Because of this, when we pass it into the URL we would be missing a digit. To solve this problem, we have to append a leading 0 to months and days. But, this starts to break down when we get to double-digit months and days, so to get around that issue we take the Text.End two characters which means that we will always have a two-character long month or day string getting passed into the URL.
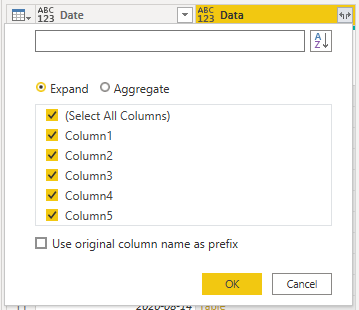
Now that we have passed in our dates to the URL and have a table-valued column, we can expand it using the button in the top right:
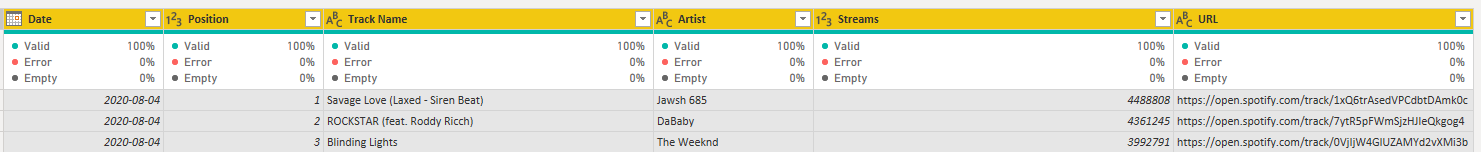
Since we have all these new columns without useful names, let’s look at the data and rename the columns to what they really are:
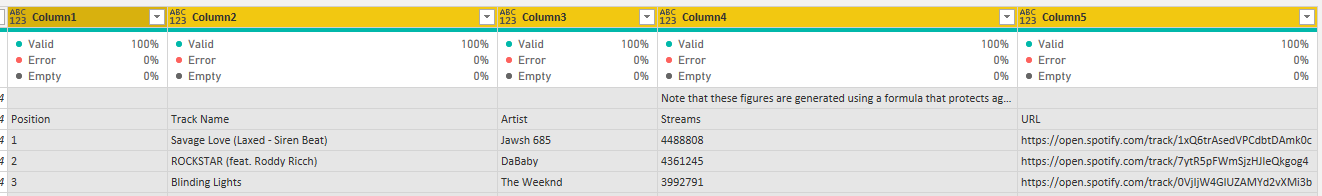
Now, it might be tempting to remove the first row and promote to headers to resolve this issue, but we have to account for the fact that these two extra rows will appear for every date that is in our date range. So, with that in mind, we can manually rename the columns and then filter out the old headers with the drop-down menu:
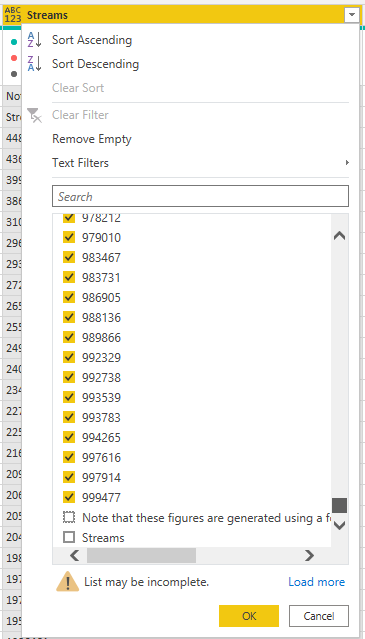
I'm using Streams to filter because both of the garbage rows have actual values in them, allowing for true nulls to be preserved. To get these values to show up, I had to load more values and then scroll to the bottom of the list to uncheck them.
Then, because being lazy is great, select all the columns in the table and use "Detect Data Type" under "Transform" in the ribbon:
And, with that, we have pulled in our data!
I’ve included a link to our GitHub for you to download the full PBIX I used in this post in case you want to copy some of the code or just root around in its guts for a bit. It includes a report I built to analyze the data and a bonus query to pull in the weekly data.
https://github.com/kizantech/AAG_BlogPosts/tree/master/Spotify%20Data%20Pull

KiZAN is a Microsoft National Solutions Provider with numerous gold and silver Microsoft competencies, including gold data analytics. Our primary offices are located in Louisville, KY, and Cincinnati, OH, with additional sales offices located in Tennessee, Indiana, Michigan, Pennsylvania, Florida, North Carolina, South Carolina, and Georgia.