

In today's fast-paced business landscape, staying ahead of the competition requires efficient and effective solutions. According to Microsoft’s Work Trend Index, nearly 70% of employee report that they don’t have sufficient time in the day to focus on “work”, with more time being spent Communicating than Creating.
Microsoft 365 Copilot is designed, with Microsoft’s cloud trust platform at its core, to allow for employees to both be more productive, reduce the time spent searching for information, performing mundane tasks, and other low-value activities.
Power BI
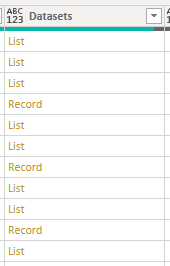
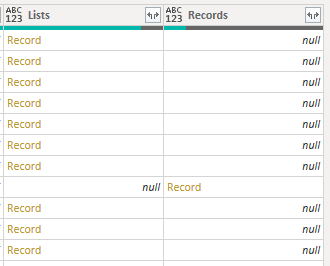
Recently when working with a JSON file in Power BI I was faced with a problem. I had a field in the JSON file that could contain one or many records in it. The built-in parsing identified the rows as being a mixture of records and lists (there is no native way to expand only the lists and then records). Because of this, it wasn’t able to extract the values from the column.
Here is an example of what the data I am trying to parse looks like in Power BI:
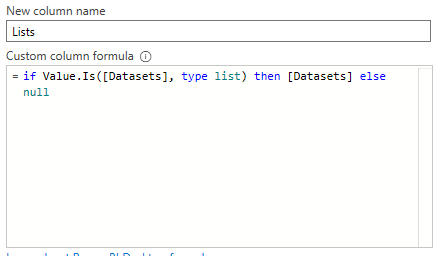
This lead to some frantic googling trying to hit a deadline and I stumbled across this StackOverflow post. It uses the M function Value.Is to check the type of record in a column. The code in the StackOverflow answer uses this function to only return records of a given type, letting you create a custom column that only contains lists or records.
Here is an example of the code that was used in the custom column:
If Value.Is([Column], type record) then [Column] else null
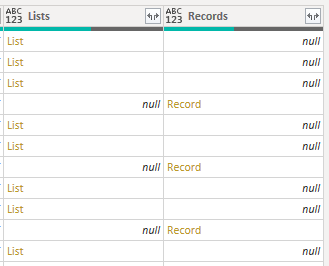
Armed with this code, we can create two columns containing only lists or records respectively:
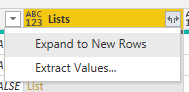
With the two types split out, we can expand the lists into records and make this whole mess much easier to deal with:
Now that all the rows have the same type, we will combine them into a single column to make expanding the records easier and more efficient. I did this by using a conditional column to check for nulls in Records and replace them with Lists:
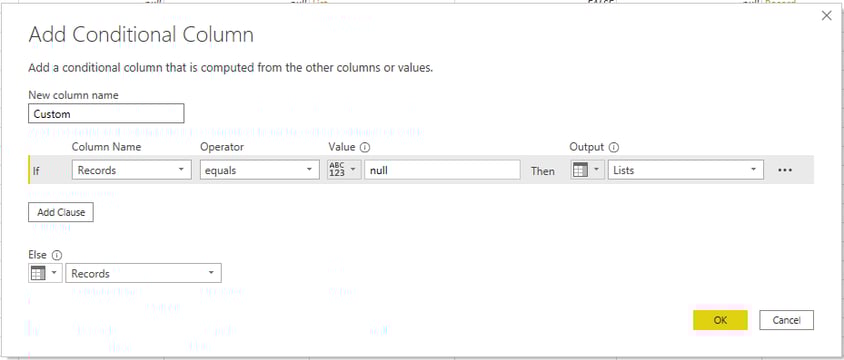
(Note: Power BI uses the text value of “null” to represent a true null, not a blank in the Value field)
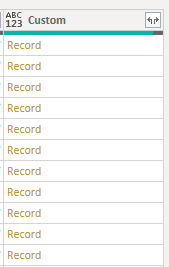
Now that all the values are records in a single column, it’s easy to just expand the values:
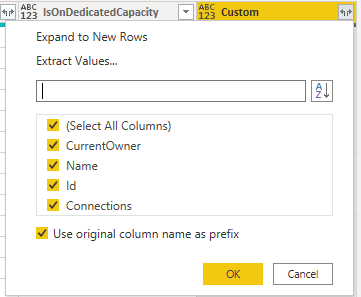

After all that, you're off to the races! If you’re still hungry for data sourcing weirdness, check out Jimmy Dobbins’ post about Web Scraping NFL data with Power BI.
 KiZAN is a Microsoft National Solutions Provider with numerous gold and silver Microsoft competencies, including gold data analytics. Our primary offices are located in Louisville, KY, and Cincinnati, OH, with additional sales offices located in Tennessee, Indiana, Michigan, Pennsylvania, Florida, North Carolina, South Carolina, and Georgia.